

KARVY WEALTH MAXIMIZER - MARCH 2018
2
Wealth Maximizer
Mar 26, 2018
Wealth Maximizer
Company Name NSE Symbol Sector
Market Cap
(Rs. Mn.)
CMP*
(Rs.)
Target
Price (Rs.)
Upside
(%)
Adani Ports & Special
Economic Zone Ltd
ADANIPORTS Marine Port & Services 750513 362 474 31
Aurobindo Pharma Ltd AUROPHARMA Pharmaceuticals 323202 552 826 50
Bharti Airtel Ltd BHARTIARTL Telecommunications 1649727 413 573 39
Hindalco Industries Ltd HINDALCO Metals 462238 206 310 50
Indiabulls Housing Finance Ltd IBULHSGFIN NBFC 512014 1200 1561 30
Indian Oil Corp Ltd IOC Oil Marketing & Distribution 1639839 169 247 46
State Bank of India SBIN Banking 2026806 235 360 53
Tata Motors Ltd TATAMOTORS Automobiles 1050318 331 479 45
Tata Steel Ltd TATASTEEL Metals 648200 567 835 47
UPL Ltd UPL Agrochemicals 358220 705 1003 42
*As on Mar 23, 2018, Please CLICK HERE for previous Wealth Maximizer report

KARVY WEALTH MAXIMIZER - MARCH 2018
3
MARKET OUTLOOK
Looking Beyond the Correction
Normalization of volatility:
In the past couple of months, markets have
witnessed a rise in volatility; however, it is still below the 20 year historical average
of 22%. We believe that the volatility regime is shifting to a more normal one.
A correction, not a crash:
We believe that the market is experiencing a
correction (Sensex down 10.1% from recent high), but not a crash. This is on
account of the following reasons:
The Indian economic data is likely to improve over the coming months. In
Q3FY17-18, the economy grew at 7.2% compared to an estimate of 6.9%, in
Q2FY17-18 the GDP growth rate was 6.5%.
IMF in its latest update forecasted a growth rate of 7.4% for FY18-19 and 7.8%
in FY19-20. Leading indicators also point to a pickup in the months ahead. The
OECD leading indicator has picked up after its bottom in March 2017.
Global growth remains supportive. Growth is forecasted to pickup to 3.9% in
CY18 from 3.7% in CY17 and 3.2% in CY16.
Though it is early, IMD has indicated that the probability of an unfavorable
monsoon is low.
However, the following factors are likely to limit upside.
Beginning of trade disputes around the world, especially the prospect of
escalation between the US and China, the two largest economies.
Ongoing process of resolution of NPAs in the banking sector.
State elections in states (Karnataka, Mizoram, Rajasthan, Chhattisgarh and
Madhya Pradesh) in the run up to the general elections, which are to be held
by May 2019.
Outlook:
Though volatility is likely to rise, we believe that the markets will move up and
deliver decent returns during the year, we forecast Sensex to end year 2018 at
37500, which represents a 1 year forward PE of 16.5x, and an upside of 15% from
the current levels.
In the following pages, we highlight 10 Nifty stocks that have the potential to deliver
good returns over the next 12 months, based on consensus target price.

KARVY WEALTH MAXIMIZER - MARCH 2018
4
Exhibit: Volatility rising from low levels
Source: Bloomberg, Karvy Research
Exhibit: Rise in policy uncertainty likely to support rise in Volatility
Source: www.policyuncertainty.com, Karvy Research
Exhibit: OECD Leading indicator shows economy likely to accelerate
Source: OECD, Karvy Research
0%
10%
20%
30%
40%
50%
60%
Mar/1999
Mar/2000
Mar/2001
Mar/2002
Mar/2003
Mar/2004
Mar/2005
Mar/2006
Mar/2007
Mar/2008
Mar/2009
Mar/2010
Mar/2011
Mar/2012
Mar/2013
Mar/2014
Mar/2015
Mar/2016
Mar/2017
Mar/2018
Volatility
Average
97
99
101
103
Jun-94
Apr-95
Feb-96
Dec-96
Oct-97
Aug-98
Jun-99
Apr-00
Feb-01
Dec-01
Oct-02
Aug-03
Jun-04
Apr-05
Feb-06
Dec-06
Oct-07
Aug-08
Jun-09
Apr-10
Feb-11
Dec-11
Oct-12
Aug-13
Jun-14
Apr-15
Feb-16
Dec-16
Oct-17
0
50
100
150
200
250
300
2003
2004
2005
2006
2007
2008
2009
2010
2011
2012
2013
2014
2015
2016
2017
2018

KARVY WEALTH MAXIMIZER - MARCH 2018
5
India Research - Stock Broking
Recommendation (Rs.)
CMP (as on Mar 23, 2018) 362
Target Price 474
Upside (%) 31
Stock Information
Mkt Cap (Rs.Mn/US$ Mn) 750513 / 11541
52-wk High/Low (Rs.) 452 / 317
3M Avg.daily value (Rs. Mn)
1556.0
Beta (x) 1.7
Sensex/Nifty 32597 / 9998
O/S Shares(mn) 2071.0
Face Value (Rs.) 2.0
Shareholding Pattern (%)
Promoters 65.8
FIIs 18.0
DIIs 12.1
Others 4.1
Stock Performance (%)
1M 3M 6M 12M
Absolute (11) (10) (10) 11
Relative to Sensex (7) (6) (12) 0
Source: Bloomberg
Bloomberg Code: ADSEZ IN
Adani Ports & Special Economic Zone Ltd
Valuation Summary
YE Mar (Rs. Mn) FY16 FY17 FY18E FY19E FY20E
Net Sales 71087 84340 103610 113874 127182
EBITDA 46273 54182 68147 74310 82128
EBITDA Margin (%) 65.1 64.2 65.8 65.3 64.6
Adj. Net Profit 28794 38858 37418 42390 48824
EPS (Rs.) 18.8 19.1 20.5 23.5 31.8
RoE (%) 29.0 23.0 23.7 24.0 25.5
PE (x)* 13.2 17.7 17.7 15.4 11.4
Source: Bloomberg, Karvy Research, *Represents multiples for FY16 & FY17 are based on historic market price
Relative Performance*
Source: Bloomberg; *Index 100
95
110
125
140
Mar-17
Apr-17
May-17
Jun-17
Jul-17
Aug -17
Sep-17
Oct-17
Nov-17
Dec-17
Jan
-18
Feb-18
Mar-18
ADSEZ
Sensex
Expansion and Mundra Port Legacy to Drive Growth
A very unique port, one of its kind: The Mundra port managed by
APSEZ is the largest among all and has handled 91.95MMT of cargo for
9M FY18 and is expected to cross 115MT by FY18E. Mundra port has
given exceptional performance by growing revenue 10 times during last
decade and marked itself as one of the fastest growing ports. Mundra
port is a multipurpose port and at present manages 26 berths and two
single point mooring with an installed annual capacity of 228MT. The cargo
handled at Mundra port includes coal, container, crude, fertilizers, steel
and project cargo. Mundra also contains India’s largest Special Economic
Zone (SEZ) with 8300 hectares which acts as a value addition to Mundra
port. The company is aiming a tonnage growth of 15-20% CAGR over the
next few years.
Expansion to drive the growth: Expansion of Dhamra to make it
handle containers and making Kattupalli port a multipurpose cargo
port could be the growth driving factors. Coal handling is expected to
increase on the back of higher electricity demand and lower inventory at
different power plants. Ennore terminal has also started operations from
Jan’18, therefore the increasing volume can be factored in coming
quarters, to make all the sites operational company plans to incur a capex of
Rs. 25000 -28000 Mn. As a result of above strategies company expects
the container and cargo volume to grow by 20% and 12% respectively.
Diversification aiding overall improvement: APSEZ is consistently
delivering growth with gaining market share. Total cargo volumes grew by
7% for 9MFY18 to 135MMT. Container volume has also grown across all
ports. Growth was realized across ports with cargo volumes at Mundra,
Hazira, and Katupalli up 8%, 10% and 45%.
Valuation and Risks: Healthy growth of container and cargo volumes,
coming in from the expansion plans are the key positives. Stock is currently
trading at 11.4x. The consensus values the company at 14.9x for a target
price of Rs. 474, representing an upside potential of 31%.

KARVY WEALTH MAXIMIZER - MARCH 2018
6
Company Background
Incorporated as Gujarat Adani Port Ltd on May 26, Adani Ports and Special Economic Zone (APSEZ) is India’s largest
private multi-port operator, post entering concession agreement with GMB to build, operate and maintain the port for a
period of 30 years till 2031 extendable by another 20 years. The port is into providing cargo handling services for bulk,
crude and container cargo. While the company is also bidding for other domestic and international port projects, it has
also invested in value added services like logistics support, providing container rail services and inland container depots
to diversify from its core port business.
ADANIPORTS: Technical View
ADANIPORTS is India’s largest ports developer and Operator Company promoted by the Adani group. They have
built, acquired and developed an unparalleled portfolio of ports infrastructure and services across India. In the
secondary market, ADANIPORTS has fallen over 20% from its all time high, which it made in the month of January
2018 and has plunged down, placing it below all its major moving averages on the daily chart. On the daily chart,
the stock is in correction phase and may plunge downside in near future as it has breached its long term moving
average of 200 DEMA placed around Rs. 385-386 levels. On the oscillator front, the 14 period RSI is indicating
weakness and is placed near the oversold region, indicating a reversal in the counter. While on the weekly chart, the
stock has breached its support zone of Rs. 380-385 levels and has plunged downside. On the Bollinger band, the
stock is on the verge of breaching its lower band and is expected to plunge downside in near future. However, the
stock is having multiple supports placed around the levels of Rs. 325-330 levels which would be a crucial zone for
the counter to look upon. If it is able to sustain above the same mentioned levels, then a reversal can be seen in the
counter. Also the 14 week RSI is near to bottom out at its oversold area. On the monthly chart, the stock is still in an
uptrend making higher highs and higher lows, indicating inherent strength in the counter from medium to long term
perspective. Even the Parabolic SAR (Stop and Reverse) is placed below the price, indicating buying in the counter
is still intact from long term perspective. On the flip side, the immediate resistance is placed around the previous
support i.e Rs. 390-400 levels, breaching which the stock might surge towards its all time high levels of Rs. 450 and
even further. At current juncture and considering all the data mentioned above, one may go long in the counter on
any dip towards the mentioned support zone for an immediate upside of the its all time high, breaching which the
stock might move in the uncharted territory from long term perspective.

KARVY WEALTH MAXIMIZER - MARCH 2018
7
India Research - Stock Broking
Recommendation (Rs.)
CMP (as on Mar 23, 2018) 552
Target Price 826
Upside (%) 50
Stock Information
Mkt Cap (Rs.Mn/US$ Mn) 323202 / 4970
52-wk High/Low (Rs.) 809 / 503
3M Avg.daily value (Rs. Mn)
1670.7
Beta (x) 0.9
Sensex/Nifty 32597 / 9998
O/S Shares(mn) 585.9
Face Value (Rs.) 1.0
Shareholding Pattern (%)
Promoters 51.9
FIIs 18.9
DIIs 15.6
Others 13.7
Stock Performance (%)
1M 3M 6M 12M
Absolute (8) (19) (24) (20)
Relative to Sensex (4) (16) (25) (28)
Source: Bloomberg
Bloomberg Code: ARBP IN
Strong US Drug Pipeline to Drive Growth
Volumes to drive injectables segment in US: The US injectables
business has grown at 39% and 67% in FY16 and FY17 to USD157Mn.
However, recent USFDA inspection was a minor setback but with the
observations being largely procedural, company expects to clear the
same, and launch new products in the next fiscal. Overall, 35 to 40 new
launches in the injectables business are expected in the next fiscal and
management has guided the business to grow to US$ 240Mn.
USFDA observations on Unit 4 largely procedural: The recent
observations by USFDA post the plant inspections on Unit 4 (injectables)
are mostly procedural (not quality related). USFDA has requested rework
on the monitoring of implementation process. The issues are expected
to be resolved in FY19E. The company has also undertaken a de-risking
strategy of mapping other units as manufacturing options for its major
drugs to ensure least disruption in sales in case of any plant issues.
European business thriving: European business (26% revenues),
continues to post strong growth (16% YoY, constant currency). The top
5 countries in the region - Italy, Germany, UK, Spain and France, posted
double-digit growth in Q3FY18. Auro also managed to turn around the
Actavis business, which was loss making at the time of acquisition to
profitability on the back of shifting manufacture of products to India. As
of Q3FY18, manufacture of 78 out of 112 drugs have been shifted to
India. Going forward, management expects 8%- 10% growth on constant
currency basis from the region.
Valuation and Risks: Backed by strong pipeline of launches,
and continued improvements in European performance, consensus
expectations for revenue and PAT stoods at 10% CAGR over the
FY17-20E. As per bloomberg consensus, Auro is valued at 16x on
FY20E EPS of Rs. 52.8 and recommend “BUY” with a target price of
Rs. 826, an upside potential of 50%. Key risks are delay in clearing USFDA
observations and further price erosions.
Aurobindo Pharma Ltd
Valuation Summary
YE Mar (Rs. Mn) FY16 FY17 FY18E FY19E FY20E
Net Sales 137097 148448 166491 183745 199863
EBITDA 31931 34406 39545 43016 46994
EBITDA Margin (%) 23.3 23.2 23.8 23.4 23.5
Adj. Net Profit 20242 23060 25338 27895 30647
EPS (Rs.) 34.6 39.4 43.5 48.0 52.8
RoE (%) 32.6 27.6 23.4 20.9 19.2
PE (x)* 21.3 17.0 12.8 11.6 10.6
Source: Bloomberg, Company, Karvy Research, *Represents multiples for FY16 & FY17 are based on historic market price
Relative Performance*
Source: Bloomberg; *Index 100
65
80
95
110
125
Mar-17
Apr-17
May-17
Jun-17
Jul-17
Aug -17
Sep-17
Oct-17
Nov-17
Dec-17
Jan
-18
Feb-18
Mar
-18
ARBP
Sensex

KARVY WEALTH MAXIMIZER - MARCH 2018
8
Company Background
Aurobindo Pharma Ltd (Aurobindo) is one of India’s leading manufacturer of generic pharmaceuticals and active
pharmaceutical ingredients. Company has presence in over 150 countries, majorly spread in USA (44% of revenues)
and Europe (with key focus markets being US and Europe). It has significant presence in USA (44% of revenues) and
Europe (26% of revenues). Its product portfolio spans across categories such as antibiotics, anti-retrovirals (ARV), CVS,
CNS, gastroenterological, pain management and anti-allergic. Aurobindo is amongst the top-5 ARV suppliers to global
funding agencies.
AUROPHARMA: Technical View
AUROPHARMA has been under tremendous selling pressure from the past few months owing to the overall bearish
trend in the entire pharmaceuticals space. The shorter term chart structure of the stock indicates formation of lower
tops and lower bottoms. However, the longer term chart patterns indicate that the stock is consolidating in a wide
range between Rs. 500 - Rs. 800 on the weekly charts and is currently hovering around the lower end of the said
trading band. The stock has immediate supports pegged around Rs. 520 - Rs. 500 below which the next meaningful
support zone for the stock lies around Rs. 480 - Rs. 470. Whereas on the upside, the stock has its immediate
supply zone around Rs. 630 - Rs. 650 crossing which a surge towards a potential upside target zone around
Rs. 780 - Rs. 800 levels may also be seen in the counter. Technical parameters like the RSI and ADX do not indicate
a rosy picture for the stock at the current juncture. However, things may get better for the market leader in Semi-
Synthetic Penicillins, if it manages to hold and sustain above the immediate support levels as mentioned above.
The monthly chart structure of the stock suggests formation of cycles of higher highs and higher lows, which clearly
indicates that the long term chart structure is still bullish and the current decline in the price of the stock is a normal
technical correction. In the past, it has also been observed that every time the stock has made a cycle of higher low
preceded by a higher high, it has always seen value buying from such levels, which gives investors with a longer
term horizon a brilliant break to go long in the counter at current levels with a stop loss placed below Rs. 430, for
the aforesaid target levels in about a year’s time.

KARVY WEALTH MAXIMIZER - MARCH 2018
9
India Research - Stock Broking
Recommendation (Rs.)
CMP (as on Mar 23, 2018) 413
Target Price 573
Upside (%) 39
Stock Information
Mkt Cap (Rs.Mn/US$ Mn) 1649727/25368
52-wk High/Low (Rs.) 565 / 333
3M Avg.daily value (Rs. Mn)
3937.1
Beta (x) 0.9
Sensex/Nifty 32597 / 9998
O/S Shares(mn) 3997.4
Face Value (Rs.) 5.0
Shareholding Pattern (%)
Promoters 67.1
FIIs 18.8
DIIs 12.0
Others 2.1
Stock Performance (%)
1M 3M 6M 12M
Absolute (3) (22) 4 22
Relative to Sensex 2 (19) 2 10
Source: Bloomberg
Bloomberg Code: BHARTI IN
Emerging as a Major Player Post Consolidation
Continues to grow its network in the consolidation phase:
Bharti Airtel (Airtel) has emerged as one of the 3 major players post the
regulatory changes and the entrance of Reliance Jio. The company has a
subscriber base of 290.1mn and data subscriber reach of 70.8mn. It was
also an early entrant into the 4G spectrum and now commands a pan India
presence. While the price wars and regulatory issues disturbed the smaller
players, Bharti moved to acquire players such as Tata Teleservices (TTSL)
and Telenor. With increased presence (pan India) post consolidation,
regulatory hurdles at its final leg, and Reliance Jio’s discounting of tariff
beginning to diminish, Bharti stands to significantly gain in the long term.
African operations a key to long term growth: The African
operations continue to see increased profitability (post the sale of Ghana
operations). EBITDA margins in Q3FY18 stood at of 35.5%, up 220bps.
African business contributes nearly 24% of the consolidated EBITDA (as of
Q3FY18). The management sees African business as a key growth driver in
the long term and thus is ramping up the business in the region. Capex in
Africa for Q3FY18 stood at US$ 75mn vs less than US$100mn in H1FY18.
In the last leg of regulatory hurdles: Cut in interconnect usage
charges (ICU) for international calls had eroded average revenue per user
(ARPU) by Rs. 16 (in Q3FY18) but regulatory issues have eased off. As the
industry moves past these hurdles, and Jio’s tariff discounting continues to
diminish, ARPU (Rs. 123 for Q3FY18) will move up from the current levels.
Valuation and Risks: The breadth of Bharti’s telecom business,
improving overseas operations and diversified services such as the tower
digital business has helped Airtel consolidate during this phase, while
many of the smaller players moved out of business. The stock is valued at
39x on Bloomberg consensus FY20E EPS of Rs. 14.7 and recommend
“BUY” with a target price of Rs. 573, a potential upside of 39%. Key risks
are continued aggressive pricing by peers, further regulatory hurdles.
Bharti Airtel Ltd
Valuation Summary
YE Mar (Rs. Mn) FY16 FY17 FY18E FY19E FY20E
Net Sales 965321 954683 854365 904564 1017954
EBITDA 339842 353298 308809 337719 399993
EBITDA Margin (%) 35.2 37.0 36.1 37.3 39.3
Adj. Net Profit 45363 40284 16405 28760 57136
EPS (Rs.) 11.3 10.1 3.8 7.5 14.7
RoE (%) 8.5 9.4 5.7 2.3 4.4
PE (x)* 30.5 34.4 109.1 55.0 28.1
Source: Bloomberg, Company, Karvy Research, *Represents multiples for FY16 & FY17 are based on historic market price
Relative Performance*
Source: Bloomberg; *Index 100
85
105
125
145
165
Mar-17
Apr-17
May-17
Jun-17
Jul-17
Aug -17
Sep-17
Oct-17
Nov-17
Dec-17
Jan-18
Feb-18
Mar-18
BHARTI
Sensex

KARVY WEALTH MAXIMIZER - MARCH 2018
10
Company Background
Bharti Airtel India, headquartered in New Delhi, India, along with its subsidiaries, is a leading telecommunications services
company with operations across 20 countries including India, Bangladesh, Srilanka, and Africa. Its operations pan
across all 22 telecom circles and has a total subscriber base of 290.1Mn (market share of ~24%) in India. It has namely
4 verticals - Airtel business - provides voice, data, video, network integration, data center, and managed services, Tower
Infrastructure Services business that engages in setting up, operating, and maintaining wireless communication towers,
Homes Services business that provides voice and data communications through fixed-line network and broadband
technology, and Digital TV business offers digital broadcasting services under the direct-to-home platform.
BHARTIARTL: Technical View
Bharti Airtel Limited is an Indian global telecommunications services company based in New Delhi, India. It operates
in 16 countries across South Asia and Africa. Airtel provides GSM, 3G, 4G LTE and VoLTE mobile services, fixed line
broadband and voice services depending upon the country of operation. It is the largest mobile network operator
in India and the third largest in the world with over 386 million subscribers. Airtel was named India’s second most
valuable brand in the first ever Brandz ranking by Millward Brown and WPP Plc. Technically, Bharti Airtel was in a
secular uptrend since 2003, forming higher highs and higher lows as seen on the monthly charts. However, from
2007 the stock is strictly trading in a range of Rs. 276 to Rs. 564 levels and is holding the same. The 55 day CCI is
in the monthly chart is trading above the zero levels, indicating that the stock is poised to trade with a positive bias.
Similarly, the MACD (12, 26, 9) in the monthly charts are plotting above zero line, indicating the bullishness in the
stock. Even the Parabolic SAR (Stop and Reverse) is placed below the price, indicating buying in the counter is still
intact from a long-term perspective. On the momentum setup, the 14-period weekly RSI managed to sustain above
40-levels during recent price correction, which indicates that bulls are in control and price correction in the stock is
being utilized as a buying opportunity by long-term investors in the counter. In the current scenario, considering all
the data mentioned above, one may go long in the counter on dips towards the mentioned floor support zone for
an immediate upside target towards the said range ceiling levels, breaching which the stock might move towards its
all-time highs in the long-term perspective.

KARVY WEALTH MAXIMIZER - MARCH 2018
11
India Research - Stock Broking
Recommendation (Rs.)
CMP (as on Mar 23, 2018) 206
Target Price 310
Upside (%) 50
Stock Information
Mkt Cap (Rs.Mn/US$ Mn) 462238 / 7108
52-wk High/Low (Rs.) 284 / 179
3M Avg.daily value (Rs. Mn)
2369.4
Beta (x) 1.2
Sensex/Nifty 32597 / 9998
O/S Shares(mn) 2245.0
Face Value (Rs.) 1.0
Shareholding Pattern (%)
Promoters 34.7
FIIs 29.7
DIIs 28.5
Others 7.1
Stock Performance (%)
1M 3M 6M 12M
Absolute (16) (23) (11) 6
Relative to Sensex (13) (20) (13) (4)
Source: Bloomberg
Bloomberg Code: HNDL IN
One of the Largest Aluminium Producers
Growing Demand for Aluminium Sheets will Trigger Sales: The
growing demand for rolled aluminum sheets will considerably be accretive
to the topline of Hindalco. Carmakers are using more of Lightweight metal
in vehicles to help meet stricter fuel efficiency targets. Novelis, plans to
further expand the Automotive-products share of its portfolio, from 18% in
fiscal 2017. The acquisition of Novelis made Hindalco the world’s largest
producer of rolled-aluminium products.
Push in Aluminium Capacity Growth: “Make in India” push is
likely to drive manufacturing expansion and infrastructure spending. And
Hindalco, now is more focused on capacity expansion of Utkal Alumina
(100% subsidiary of Hindalco industries). This would help fuel the nation’s
surging growth in aluminium capacity. The capacity for 2017 has likely
increased as new projects were completed, and Hindalco Industries Ltd
will be one of major beneficiary.
Focus on Premium goods for better profitability: Novelis,
(wholly owned subsidiary of Hindalco) which converts primary aluminium
into flat-rolled products, aims to improve its mix to produce higher
value-added product in order to boost profitability. The downstream
producer has increased Research and Development spending over the
past three financial years, to raise conversion charges and lift the share of
higher-margin products such as automotive sheets. These measures have
contributed to boost Novelis’ EBITDA in the three years through the fiscal
year ended March. Novelis is the largest producer of rolled-aluminium
products, accounting for about 14% of global supply.
Valuation and Risks: The company is trading at 8x on (Bloomberg
Consensus) FY20E EPS of Rs. 25.64 and is valued at 12x with a “BUY”
recommendation and a target price of Rs. 310, an upside potential of
50%. Any slowdown in US auto demand would affect the Novelis (wholly
owned subsidiary of Hindalco) Profitability is the risk factor.
Hindalco Industries Ltd
Valuation Summary
YE Mar (Rs. Mn) FY16 FY17 FY18E FY19E FY20E
Net Sales 981276 995990 1172008 1217820 1258300
EBITDA 84200 127370 142680 151550 154960
EBITDA Margin (%) 8.6 12.8 12.2 12.4 12.3
Adj. Net Profit (2500) 21890 45750 53640 57000
EPS (Rs.) (1.3) 11.0 21.0 23.8 25.6
RoE (%) (0.7) 4.5 9.7 10.2 10.3
PE (x)* NA 17.7 10.3 9.1 8.5
Source: Bloomberg, Company, Karvy Research, *Represents multiples for FY16 & FY17 are based on historic market price
Relative Performance*
Source: Bloomberg; *Index 100
80
103
126
149
Mar-17
Apr-17
May-17
Jun-17
Jul-17
Aug -17
Sep-17
Oct-17
Nov
-17
Dec-17
Jan-18
Feb
-18
Mar-18
HNDL
Sensex

KARVY WEALTH MAXIMIZER - MARCH 2018
12
Company Background
Hindalco Industries Ltd, the metals flagship company of the Aditya Birla Group is the world’s largest aluminium
rolling company and one of the biggest producers of primary aluminium in Asia. Hindalco was founded in 1958 and
commissioned its aluminum facility at Renukoot in eastern Uttar Pradesh, India in 1962. Later acquisitions and mergers,
with Indal, Birla Copper and the Nifty and Mt. Gordon copper mines in Australia strengthened its position in value-added
alumina, aluminium and copper products. The acquisition of Novelis Inc. in 2007 positioned the company among the
top five aluminium majors worldwide and the largest vertically integrated aluminium company in India. The company’s
aluminium units across the globe encompass the entire gamut of operations, from bauxite mining, alumina refining
and aluminium smelting to downstream rolling, extrusions, foils, along with captive power plants and coal mines. The
company’s copper unit, Birla Copper, produces copper cathodes (used to make copper wires), continuous cast copper
rods and other by-products, such as gold, silver and DAP fertilizers.
HINDALCO: Technical View
HINDALCO: The stock has been in a secular bull trend from last one year making higher highs & higher lows on
the longer term charts, clearly indicating overall strength in the counter. After clocking a high of Rs. 184 odd levels
in January 2018, stock has been witnessing a profit taking move or is in a short term corrective phase, which is a
normal phenomenon in bull markets. The stock is currently available to be bought near to its 100-week Exponential
Moving Average, which is placed around Rs. 200-202 levels, and such dips in the stock should be utilized as
good opportunity for long term investors to accumulate the stock at current levels. Also key swing supports for the
Aluminium major rests around Rs. 180 levels, indicating good demand around those levels from where value based
buying can come in. Technical indicators are moving towards the oversold region on the weekly charts and any
positive crossover like the RSI cutting the RSI average from below with substantial delivery volume is likely to bring
in a fresh round of buying in the counter. Relative Strength Index ( RSI) is trading towards the 26-points mark on the
weekly chart. The Stochastic Oscillators, which has entered the oversold region, accompanied by the RSI, can be
expected to change in line with the overall trend in the market. However, MACD which crossed-over for a bullish
indication is giving a glimmer of hope to the bulls on the monthly charts. Considering the current price volume activity
in the counter, HINDALCO is expected to trade with a bullish bias in positive terrain in the coming weeks, having
said that, the stock may witness selling pressure at higher levels, owing to regular profit taking. The first resistance
is pegged around the zone of Rs. 240-250 followed by Rs. 275-285. On the flip side, the first support is pegged
around at Rs. 185-190 and the further downside support is around be at Rs. 150-155.

KARVY WEALTH MAXIMIZER - MARCH 2018
13
India Research - Stock Broking
Recommendation (Rs.)
CMP (as on Mar 23, 2018) 1200
Target Price 1561
Upside (%) 30
Stock Information
Mkt Cap (Rs.Mn/US$ Mn) 512014 / 7875
52-wk High/Low (Rs.) 1440 / 907
3M Avg.daily value (Rs. Mn)
2145.7
Beta (x) 1.2
Sensex/Nifty 32597 / 9998
O/S Shares(mn) 426.5
Face Value (Rs.) 2.0
Shareholding Pattern (%)
Promoters 22.8
FIIs 55.3
DIIs 11.9
Others 9.9
Stock Performance (%)
1M 3M 6M 12M
Absolute (6) 1 (3) 29
Relative to Sensex (2) 5 (5) 16
Source: Bloomberg
Bloomberg Code: IHFL IN
Focus on Home Loans and Cost Profile to Improve Margins
Improvement in cost profile segment: The company intends to
diversify more into retail lending. The company expects the home loans
to contribute 66% of total loan book from 54% currently. Also company
expects the bank borrowing to come down from 39% to 30% level and
increase in the issue of bonds. The company is currently AA+ rated by two
rating agencies (AAA by other two) would reduce the cost of borrowings
due to shift from bank borrowings to bonds. It has been noted that over
last 9 months close to 64% of the borrowings is through issue of bonds.
Steady Loan growth and stable margins: IHFL continues to
diversify in the retail home loan segment which accounted for 54% of loan
book. The company’s loan assets have shown a strong growth of 28%
over FY11-9MFY18, whereas the revenues have shown a growth of CAGR
29%. The company has consistently shown an improvement in cost to
income ratio which is declining by averagely 126bps every year. With GST
and RERA issues being resolved, construction finance book growth have
also picked up as demands have been normalized.
Strong Structural drivers and Government focus: Under Pradhan
Mantri Awaas Yojana (PMAY) subsidiy eligibility cover up to 12 lakh of
home loan reduces home loan rates to 0.30% for mid-income affordable
housing. Budget 2016-17 has provided a 100% tax exemption on profits
from construction of affordable housing would be attracting organized
players. The PMAY projects have been kept out of purview of GST. Service
tax exemption on construction of affordable housing projects will lead to
reduction in prices indeed increasing affordability.
Valuation and Risks: The company fundamentals are on strong footing
and as per consensus, the operating performance will be strong which
derives a valuation of 3.5x price/book value for a target price of Rs. 1561
representing an upside potential of 30%.
Indiabulls Housing Finance Ltd
Valuation Summary
YE Mar (Rs. Mn) FY16 FY17 FY18E FY19E FY20E
Net Interest Income 30848 43905 51385 65475 82126
Net Interest Margin (%) 5.2 5.3 5.0 5.1 5.3
PAT 23447 29064 38568 47545 57350
EPS 58.8 68.0 91.0 111.2 132.4
BV/Share 253.8 286.0 328.2 396.8 450.3
P/BV 2.4 3.4 3.7 3.0 2.7
P/E 10.4 14.2 13.2 10.8 9.1
Source: Bloomberg, Company, Karvy Research, *Represents multiples for FY16 & FY17 are based on historic market price
Relative Performance*
Source: Bloomberg; *Index 100
80
100
120
140
160
Mar-17
Apr-17
May-17
Jun-17
Jul-17
Aug -17
Sep-17
Oct-
17
Nov-17
Dec-17
Jan-18
Feb-18
Mar-
18
IHFL
Sensex
KARVY WEALTH MAXIMIZER - MARCH 2018
14
Company Background
IBHF started operations in 2000 as a Non Banking Finance Company (NBFC). In early 2013, the company was reverse
merged into housing finance company. IBHF is one of the leading housing finance company in India. The company has
also launched E-Home Loans, one of its kind in the home loan industry. It has credit rating of AAA from CARE and AA+
from CRISIL and is among very few who enjoy such rating from the rating agencies. It has the presence pan India with
a strong hold in tier 1 and tier 2 cities. IBHF is one of the largest housing finance company with AUM of more than 1trn.
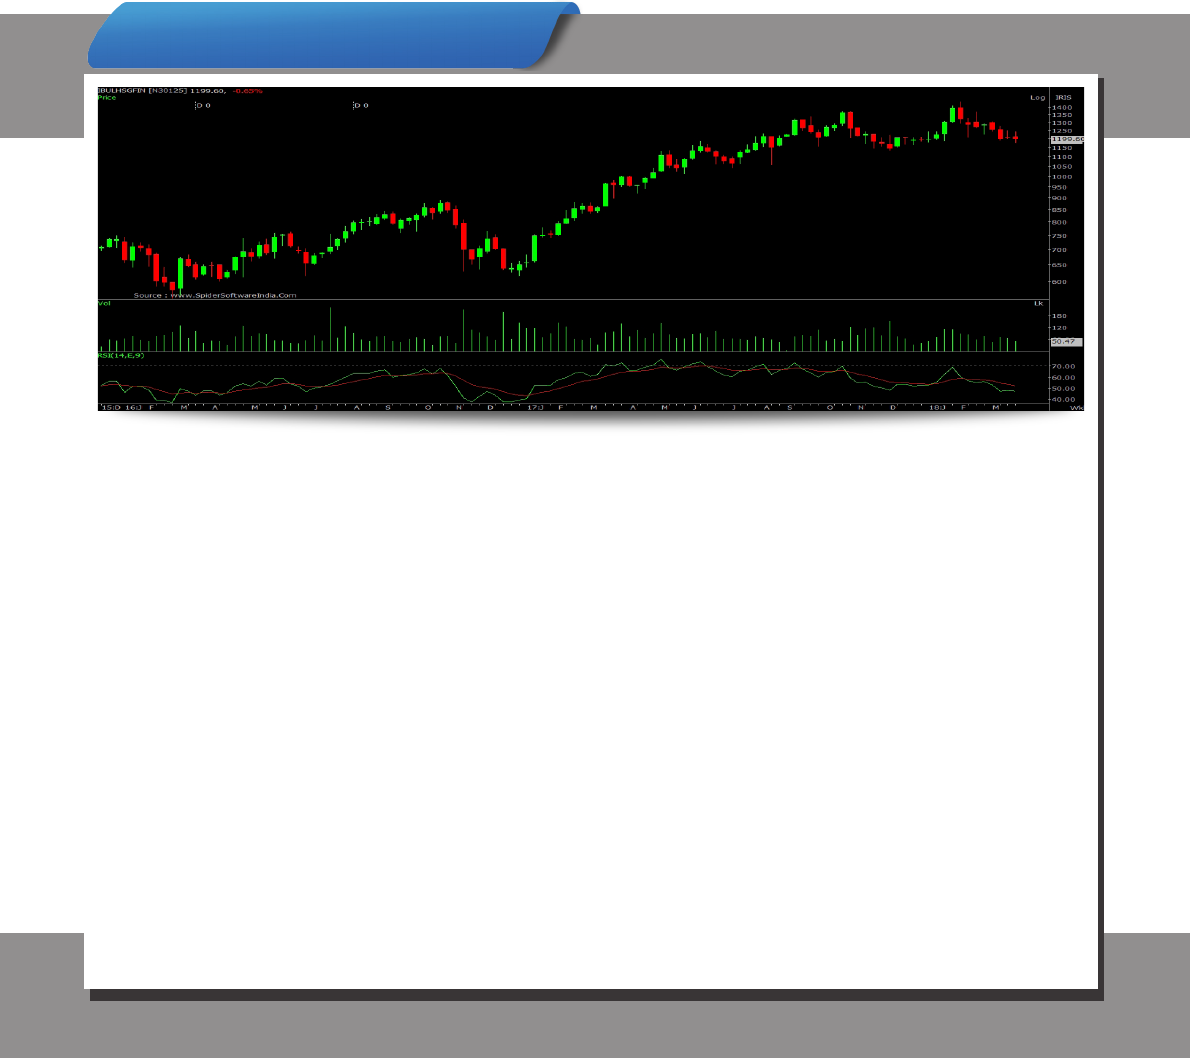
IBULHSGFIN: Technical View
IBULHSGFIN being from the BFSI sector has faced heat of the market which dragged it from its all time high of
Rs. 1440 levels which it made in the month of January 2018 towards its long term moving average on the lower
side. The stock is primarily in an uptrend making higher highs and higher lows in all time frame of the technical chart,
indicating inherent strength in the counter. On the daily chart, the stock is placed around its short and medium term
moving averages and is placed just above its 200 DEMA, suggesting a strong support for the counter. The overall
structure of the stock is positive, supported by the technical indicators. However in the short term, the stock might
see some correction towards Rs. 1145-1150 levels which is a strong support zone for the counter and which can
be utilized for better buying opportunity for the investors having time view of medium to long term. Also the stock is
placed just below the mean of the Bollinger Band (20, 2) having support of lower band at Rs. 1125-1130 levels and
upper band at Rs. 1355-1360 levels, breaching which it might surge higher on the daily chart, as volatility burst can
be expected above the mentioned range on the weekly chart. Even the 14 period RSI is near to bottoming out and
a reversal in the trend can be expected in near future. On the daily chart, the stock is placed around its 200 DEMA
and is able to sustain above it. It is also its lower band of the Bollinger (20, 2) on the daily chart which might act as
a strong support for the counter and it might surge higher towards the immediate resistance of 1300, followed by
Rs. 1420-1430 levels from short to medium term perspective. Looking to the trend of the chart from long term
perspective, the stock is having multiple support zones of Rs. 1100-1130 followed by Rs. 1040-1050 levels,
sustaining which a bull move can be expected from long term perspective. Considering all the data points mentioned
above, one may go long in the counter on any dip towards the mentioned support zone for an immediate upside
of the its all time high, breaching which the stock might move in the uncharted territory from long term perspective.
KARVY WEALTH MAXIMIZER - MARCH 2018
15
India Research - Stock Broking
Recommendation (Rs.)
CMP (as on Mar 23, 2018) 169
Target Price 247
Upside (%) 46
Stock Information
Mkt Cap (Rs.Mn/US$ Mn) 1639839/25216
52-wk High/Low (Rs.) 231 / 165
3M Avg.daily value (Rs. Mn)
2479.7
Beta (x) 0.7
Sensex/Nifty 32597 / 9998
O/S Shares(mn) 9711.8
Face Value (Rs.) 10.0
Shareholding Pattern (%)
Promoters 57.0
FIIs 7.1
DIIs 10.7
Others 25.3
Stock Performance (%)
1M 3M 6M 12M
Absolute (8) (18) (17) (10)
Relative to Sensex (4) (14) (19) (19)
Source: Bloomberg
Bloomberg Code: IOCL IN
Healthy Performance and Product Quality Upgra-
dation in Refining Segment
IndianOil refineries have achieved highest crude throughput of 65.1 Mn
tons during FY16-17 as against a 56.69 Mn tons in FY15-16. The company
has reported higher GRM of US$ 12.32/bbl during Q3FY18 compared to
GRM of US$ 7.7/bbl on the back of inventory gain during this quarter. The
refineries also have achieved the best performance in energy parameters.
The Paradip Refinery has commenced its operations in a phase manner
and achieved capacity utilization of 54.9% in FY16-17. From May 2017
onwards, Paradip refinery is operating at 100% capacity.
Marketing margins yet to improve: The company has 42.9%
market share in the domestic market and sold 74.11 Mn tons of petroleum
products during FY16-17 compared to 72.60 Mn tons during FY15-16.
During Q3FY18 domestic volume growth was driven by Aviation Turbine
Fuel (ATF) and Liquefied Petroleum Gas (LPG) sales. Margins were diluted
due to sharp increase in the crude prices. The company has managed to
add 881 retail outlets during FY16-17 taking their total number of outlets
to 26212.
Expansion in Petrochemical segment to meet the growing
demand: IOC is planning to invest Rs. 320 Bn in petrochemicals to
increase their capacity in order to meet the increasing demand for
plastics and polymers. This investment is part of the overall Rs. 1.8 Tn
Capex planned for the next 5-7 years. During FY16-17, the company has
recorded highest sales of 2.585 MMT (Million Metric Tons) during FY16-17
as against 2.528 MMT in FY15-16.
Valuation and Risks: IndianOil with its vast presence and expansion
strategies is planning to grow further. At CMP of Rs. 169, the stock
trades at 7.5x FY20E EPS. We value the stock at 11.0 FY20E EPS
based on the Bloomberg consensus and recommend a target price of
Rs. 247, representing an upside potential of 46%. However, fluctuations
in commodity prices, exchange rates and global petroleum rates are the
key risks to the company.
Indian Oil Corporation Ltd
Valuation Summary
YE Mar (Rs. Mn) FY16 FY17 FY18E FY19E FY20E
Net Sales 3383125 3486317 3952124 4352741 4654436
EBITDA 250511 340132 362592 380141 407637
EBITDA Margin (%) 7.4 9.8 9.2 8.7 8.8
Adj. Net Profit 120225 198495 197789 205164 221493
EPS (Rs.) 10.1 21.0 19.7 20.7 22.4
RoE (%) 15.1 20.7 20.6 21.4 23.1
PE (x)* 15.5 9.2 8.6 8.1 7.5
Source: Bloomberg, Company, Karvy Research, *Represents multiples for FY16 & FY17 are based on historic market price
Relative Performance*
Source: Bloomberg; *Index 100
95
103
111
119
127
Mar-17
Apr-17
May-17
Jun-17
Jul-17
Aug -17
Sep-17
Oct-17
Nov-17
Dec-17
Jan-18
Feb
-18
Mar-18
IOCL
Sensex

KARVY WEALTH MAXIMIZER - MARCH 2018
16
Company Background
Indian Oil Corporation (IOC), India’s flagship national oil company and petroleum major, was incorporated in 1959.
IndianOil accounts for nearly half of India’s petroleum products market share, with sales of 83.5 Mn tons in 2016-17.
Over 35% national refining capacity and 71% downstream sector pipelines throughput capacity are with IndianOil. IOC
is an integrated energy major with presence in almost all the streams of oil, gas, petrochemicals and alternative energy
sources. The Indian Oil Group owns and operates 11 of India’s 23 refineries, with a combined refining capacity of
80.7 million metric tons per annum (MMTPA). The IndianOil’s cross–country pipeline network of crude oil and finished
products is spread over 12,800 km in an efficient, economical and environment–friendly manner. Its throughput capacity
of 93.7 MMTPA for crude oil & petroleum products and 9.5 MMSCMD (Million Metric Standard Cubic Meter per Day) for
gas makes it one of the largest pipeline networks in the world.
IOC: Technical View
IOC: The stock has been in an uptrend since Rs. 73.85 levels made in February 2016 and rallied to its recent high of
Rs. 214.40 levels registered in the month of August 2017, a spectacular gain of 140% in a span of around one
and half year. Thereafter, the stock corrected lower towards Rs. 173.33 levels, clocked in the month of January
2018. On the daily chart, the stock has been trading in the upward sloping channel drawn from the high of
Rs. 88.05 levels made on September 2014 to the high of Rs. 208.35 levels clocked in the month of May 2017 to
the low of Rs. 168.63 levels clocked in the month of January 2014. On the price chart, the stock is trading in the
sideways range of Rs. 168-214 levels from past 6 months which appears to be just a passing by correction in its
larger uptrend as it appears to be a fourth wave correction within its larger wave three of one higher degree. Once
this wave four corrective phase is over, one may expect wave five on the higher side. The stock is flirting with its
200-day exponential moving average which is currently placed around Rs. 182 levels. The stock hasn’t traded below
8-10% of the moving average value indicating that institutional buying is present at lower levels. On the weekly chart,
the stock found support near its weekly lower Bollinger band (20, 2, S) set up in its recent correction from the highs
of Rs. 214.41 levels and bouncing back higher towards its upper weekly Bollinger band. Also on the monthly charts,
the monthly mean of monthly Bollinger band (20, 2, S) is placed around Rs. 173 levels. The 14 period RSI on the
weekly chart is currently pegged at sub Rs. 42.74 levels, indicating the stock is in bull market range. On the quarterly
charts, the prices are above its quarterly parabolic SAR, indicating long-term uptrend intact in the counter. Technical
support for the stock is placed around Rs. 160-163 levels followed by Rs. 140-145 levels while resistances are
placed at Rs. 195-200 levels followed by Rs. 225-230 levels.

KARVY WEALTH MAXIMIZER - MARCH 2018
17
India Research - Stock Broking
Recommendation (Rs.)
CMP (as on Mar 23, 2018) 235
Target Price 360
Upside (%) 53
Stock Information
Mkt Cap (Rs.Mn/US$ Mn) 2026806/31164
52-wk High/Low (Rs.) 352 / 232
3M Avg.daily value (Rs. Mn)
7185.1
Beta (x) 1.4
Sensex/Nifty 32597 / 9998
O/S Shares(mn) 8632.1
Face Value (Rs.) 1.0
Shareholding Pattern (%)
Promoters 58.0
FIIs 10.9
DIIs 22.3
Others 8.8
Stock Performance (%)
1M 3M 6M 12M
Absolute (15) (27) (10) (13)
Relative to Sensex (11) (24) (12) (21)
Source: Bloomberg
Bloomberg Code: SBIN IN
Stronger and Bigger Financial Conglomerate
Huge Deposit Base, Diverse Loan Book: SBI, the largest Indian
Bank, enjoys a diverse market base and has a healthy market share of
23% in deposits & 21% of advances. SBI enjoys a multi sector exposure,
highest being home loans (18%) followed by infrastructure (16), thus
mitigating the concentration risk. Going forward, the management is
positive about maintaining a double digit growth in loan book, owing to
traction in personal segment (home loans + auto loans) where it has the
highest market share. SBI has a strong operational infrastructure in place
making it future ready.
Rationalization to Aid Improved Profitability: SBI has a balance-
sheet with deposits of ~Rs. 26.6 Tn & advances of ~Rs. 18.5 Tn. With its
huge branch network, SBI is well positioned to tap the incremental deposits
and maintain double digit growth in retail deposits and also to maintain
higher share of CASA above ~45% for quality growth. Management
expects the merger synergies to leverage through FY18E & FY19E.
Recovery in Asset Quality & Stable NIM’s: Management sees an
improvement in asset quality due to lower retail slippages, higher recoveries
& efforts to regulate stressed sector credit. As on Dec 31, 2017, GNPA &
NNPA were at 10.4% & 5.6%. As per BASEL III guidelines, SBI has a CAR
of 12.7% with a tier-1 capital of 10.3% and CET 1(Common Equity Tier 1)
capital of 9.6%. Historically, SBI was able to maintain a net interest margin
of over 3% in the last 4 years. Strong growth in retail deposits, coupled
with over ~45% CASA, provides a case for up-tick in NIM.
Valuation and Risks: SBI with its focus on loan book growth, CASA
share in deposits, sustained NIMs of over 3% along with focus on reducing
NPAs and fresh slippages augur well in the long term. Merged SBI presents
a case for biggest and diversified balance sheet that mirrors the domestic
economy available at bargain valuations from a long term investment
perspective. Currently, SBI is trading at 0.9x PBV to consensus estimate
of FY19E BV. Rising bond yields, higher provisioning and headwinds in
realizing the synergies through merger may pose threat to the call.
State Bank of India
Relative Performance*
Source: Bloomberg; *Index 100
80
95
110
125
Mar-17
Apr-17
May-17
Jun-17
Jul-17
Aug -17
Sep-17
Oct-17
Nov-17
Dec-17
Jan-18
Feb-18
Mar-18
SBIN
Sensex
Valuation Summary
YE Mar (Rs. Mn) FY16 FY17 FY18E FY19E FY20E
Net Interest Income 573576 625481 758504 868300 971187
Net Profit 99507 104841 22390 165005 273387
EPS (Rs.) 13.0 13.4 4.5 18.8 31.1
BVPS (Rs.) 185.9 236.1 242.7 254.6 281.7
P/E (x)* 20.4 21.8 52.6 12.5 7.6
P/BV (x)* 1.4 1.2 1.0 0.9 0.8
RoE (%) 7.3 6.3 1.9 7.5 11.0
RoA (%) 0.5 0.4 0.1 0.5 0.7
Source: Bloomberg, Company, Karvy Research, *Represents multiples for FY16 & FY17 are based on historic market price

KARVY WEALTH MAXIMIZER - MARCH 2018
18
Company Background
State Bank of India is India’s largest bank offering personal banking, agricultural banking, corporate banking and NRI
banking with a consolidated balance sheet close to Rs. 33.8 lakh crore (Rs. 33.8 Tn). SBI employs over 269,219
employees and operates through a network of 24017 branches and over 58916 ATMs serving over 420 Mn customers.
SBI, along with its merged subsidiaries, provides various services like deposits, retail loans for Home, Automobile,
Education, other personal loans and corporate loans. SBI has various non-banking subsidiaries: SBI Life insurance
Company, SBI Capital Markets, SBI Funds Management and SBI Cards & Payments.
SBIN: Technical View
SBIN has been witnessing a profit taking move from its recent 52 week highs (Rs. 351) clocked in October, 2017
and has reached its medium term support zone around Rs. 220 - Rs. 230. The overall long term chart structure of
the stock is positive and looks good at current levels for long term investment. The stock being the premier PSU
Bank in the country is one of the most sought after banking stocks when it comes to investing and this decline
from the said highs gives investors an excellent opportunity to go long for potential upside technical targets of
Rs. 340 - Rs. 350 in about a year or so. As far as the technical setup of this stock is concerned, the weekly
charts indicate strong support around Rs. 220 - Rs. 230 zone below which the next levels to watch out for will be
Rs.190 - Rs. 200, where the stock has very strong support. Whereas on the upside, the immediate resistance
zone around Rs. 265 - Rs. 270 will test the patience of investors. However, if the stock manages to cross and
sustain above the mentioned immediate resistance zone, then a quick rally towards the next resistance zone around
Rs. 300 - Rs. 320 could be seen. Technical parameters such as ADX (20.65) on the weekly charts suggest that the
stock is under selling pressure at the moment. However, things could get better for the stock once it surpasses the
above mentioned resistance zone with reasonable volumes coupled with the ADX and DMI+ pointing upwards. As
far as the weekly RSI (33.42) is concerned, it is also indicating a similar scenario as it is trading below the RSI Avg.
(40.32) and the positive momentum is likely to be revived once there is a positive crossover with the RSI cutting the
RSI Avg. from below. The monthly chart structure of the stock depicts formations of cycles of higher tops and higher
bottoms which is a positive sign in itself for the long term. Hence, we recommend long term investors to go long in
the counter at current levels, average in case of declines towards Rs. 200 and hold with a stop loss placed below
Rs. 175 for the above mentioned target levels in the stipulated time frame.

KARVY WEALTH MAXIMIZER - MARCH 2018
19
India Research - Stock Broking
Recommendation (Rs.)
CMP (as on Mar 23, 2018) 331
Target Price 479
Upside (%) 45
Stock Information
Mkt Cap (Rs.Mn/US$ Mn) 1050318/16151
52-wk High/Low (Rs.) 488 / 330
3M Avg.daily value (Rs. Mn)
3435.3
Beta (x) 1.4
Sensex/Nifty 32597 / 9998
O/S Shares(mn) 2887.3
Face Value (Rs.) 2.0
Shareholding Pattern (%)
Promoters 36.4
FIIs 21.4
DIIs 17.1
Others 25.1
Stock Performance (%)
1M 3M 6M 12M
Absolute (8) (22) (20) (30)
Relative to Sensex (4) (18) (21) (37)
Source: Bloomberg
Bloomberg Code: TTMT IN
Jaguar Land Rover (JLR) witnesses strong growth in China:
China reported strong volume growth in the JLR retail and wholesale
segment at 14.6% and 14.0% YoY respectively in Q3FY18 and ~23.0%
growth YoY during 9MFY18 driven by better performance from models like
“Discovery”, “F-Pace” and “RR Sport”. On the other hand, there was some
decline in the UK and Europe due to economic and cyclicality reasons
which is expected to turn-around on the back of investments in newer
models and technology as indicated by the management.
Good response to new products results in market share gain:
TATA Motor’s (TML) new launch Nexon has performed well in the utility
segment. TATA’s total domestic utility vehicles sales volume stood at
44,138 units during YTD FY18 (Apr 2017 - Feb 2018) as compared to
16,251 vehicles in the previous period posting a growth of 171%. This led
to an increase in market share from 2.37% to 5.32% in the utility segment.
Therefore, resulting in the overall passenger vehicle segment market share
to increase from 5.62% to 6.27%. In the commercial vehicle segment,
TML’s sales volume grew at 21.6% YoY during YTD FY18 which led to a
market share gain of 83bps to 44.1%.
Future growth measures in the domestic market: After TATA
motors delivered the first batch of Tigor electric vehicles to EESL, they won
the tender to supply electric buses (~190 electric buses across 6 cities) to
FAME (Faster Adoption and Manufacturing of Electric Vehicles), indicating
faster market prominence.
Valuation and Risks: At CMP of Rs. 331, the stock is trading at P/E
6.7x for FY20E EPS. The Bloomberg consensus target price for TATA
Motors is Rs. 479 which is valued at P/E 9.7x for FY20E EPS based
on future growth prospects. However, increasing aluminum prices and
slowdown in the UK and European markets for JLR can be viewed as the
possible downside risks.
Tata Motors Ltd
Valuation Summary
YE Mar (Rs. Mn) FY16 FY17 FY18E FY19E FY20E
Net Sales 2673201 2639995 2910930 3307281 3674698
EBITDA 371520 344314 351842 444989 508949
EBITDA Margin (%) 13.9 13.0 12.1 13.5 13.9
Adj. Net Profit 107498 79842 83290 136799 166514
EPS (Rs.) 32.0 23.0 25.7 41.0 49.1
RoE (%) 17.1 10.9 12.3 16.8 17.5
PE (x)* 12.2 19.8 12.8 8.0 6.7
Source: Bloomberg, Company, Karvy Research, *Represents multiples for FY16 & FY17 are based on historic market price
Relative Performance*
Source: Bloomberg; *Index 100
60
81
102
123
Mar-17
Apr-17
May-17
Jun-17
Jul-17
Aug -17
Sep-17
Oct-17
Nov-17
Dec-17
Jan-18
Feb-18
Mar-
18
TTMT
Sensex
KARVY WEALTH MAXIMIZER - MARCH 2018
20
Company Background
Tata Motors Group, is an automobile manufacturer with a portfolio that includes a wide range of cars, sports vehicles,
trucks, buses and defence vehicles, spread across 175 countries around the globe. TATA Motor’s Jaguar Land Rover
Automotive PLC is the holding company of Jaguar Land Rover Limited, a British multinational automobile company
with its headquarters in Coventry United Kingdom. Models under the Jaguar Series include XF, XJ, F-Pace, XE etc, and
models under the Land Rover series are Defender, Discovery and Range Rover (RR) series with most prominence in the
UK, Europe, North American and Chinese regions.
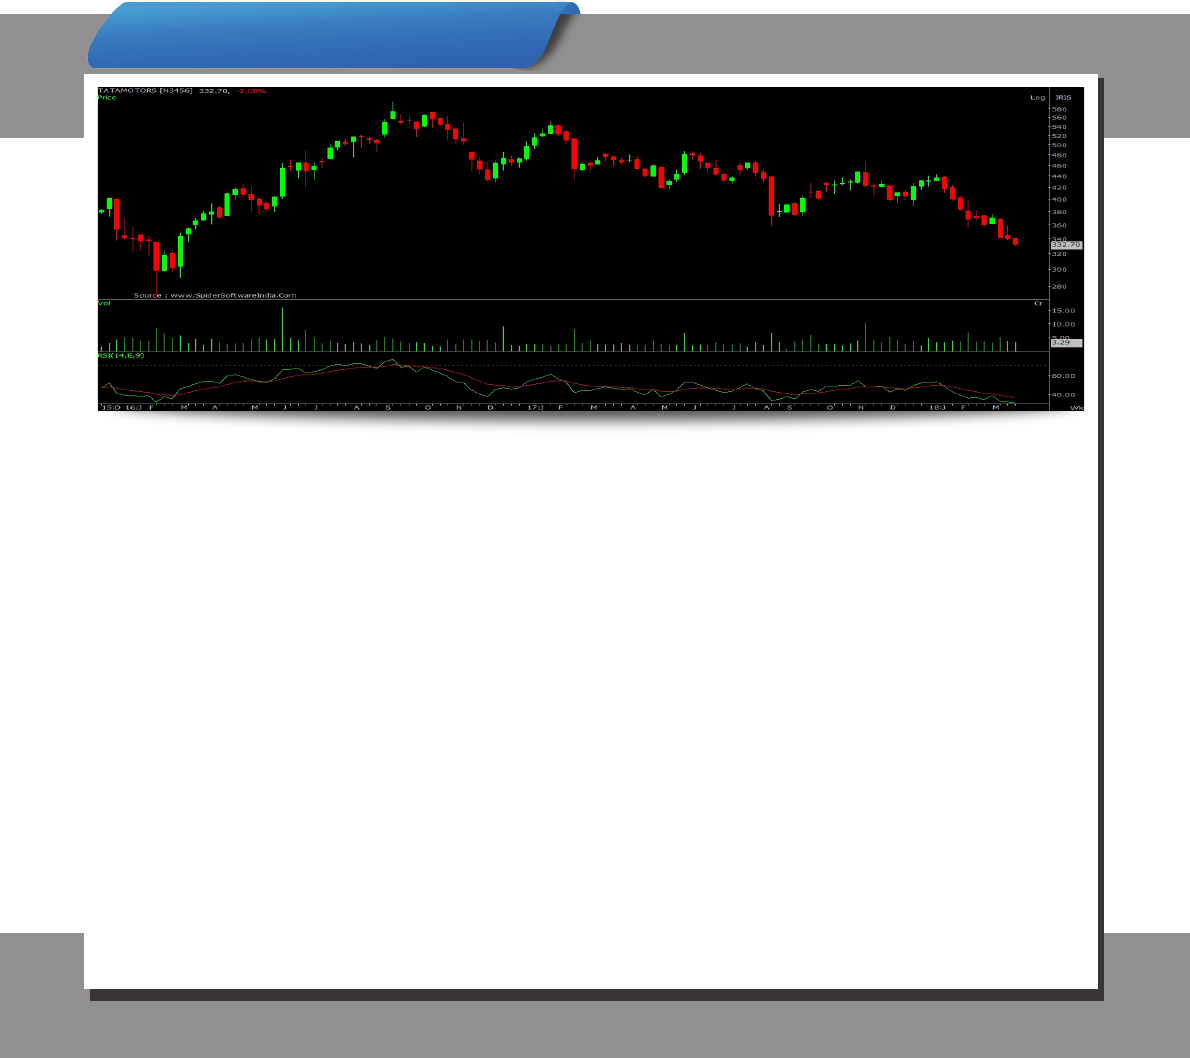
TATAMOTORS: Technical View
Tata Motors Ltd headquartered in Mumbai is an Indian multinational automotive manufacturing company and
a member of the Tata Group. Its products include passenger cars, trucks, vans, coaches, buses, sports cars,
construction equipment and military vehicles. Since Sep’17, Tata Motors is correcting from the highs at 598 levels
and is currently trading close to its support zone at Rs. 315-332 levels. The stock is finding a cluster of supports at the
current levels with the mentioned swing supports being in coincidence with the 78.6% Fibonacci ratio of the previous
upside move from Rs. 265 levels to Rs. 598 levels. On the other hand, 55 day CCI is showing bullish divergence at
current levels, indicating that the bearish momentum has been decreasing and there are more chances for rebound
in the stock price from current levels. The stock is also forming a downward sloping channel with the ceiling line
connecting the swing highs at Rs. 598, Rs. 552 and Rs. 443 levels while the floor line connects the swing lows at Rs.
468, Rs. 370 levels. This channel pattern coupled with the 55 day CCI reading may help the stock to bounce from
current levels towards Rs. 420 levels and above towards Rs. 520 levels. On the oscillator front, the 14 period RSI
is indicating weakness and is placed near the oversold region, indicating a reversal in the counter. On the monthly
chart, the stock is still in uptrend making higher highs and higher lows, indicating inherent strength in the counter
from medium to long term perspective. In the current scenario, considering all the data mentioned above, one may
go long in the counter on any dip towards the mentioned support zone for an immediate upside targets towards the
said resistance zones, breaching which the stock might move towards its all-time highs in the long-term perspective.

KARVY WEALTH MAXIMIZER - MARCH 2018
21
India Research - Stock Broking
Recommendation (Rs.)
CMP (as on Mar 23, 2018) 567
Target Price 835
Upside (%) 47
Stock Information
Mkt Cap (Rs.Mn/US$ Mn) 648200 / 9968
52-wk High/Low (Rs.) 748 / 403
3M Avg.daily value (Rs. Mn)
5491.1
Beta (x) 1.2
Sensex/Nifty 32597 / 9998
O/S Shares(mn) 1126.5
Face Value (Rs.) 10.0
Shareholding Pattern (%)
Promoters 31.4
FIIs 15.7
DIIs 29.7
Others 23.2
Stock Performance (%)
1M 3M 6M 12M
Absolute (16) (15) (8) 21
Relative to Sensex (12) (12) (10) 9
Source: Bloomberg
Bloomberg Code: TATA IN
Steady Performance From TSI; Outlook Remains Strong
Healthy growth in domestic sales volume: Tata Steel reported
good earning in 9MFY18E driven by significantly higher EBITDA/ton from
Indian operations. Considering a realization per ton of Rs. 46205 as
Kalinganagar steel plant is close to full ramp-up, EBITDA/ton came in at
~Rs. 12000 and the increase in the margin was mainly due lower other
expenses and operating leverage due to higher volumes.
Organic expansion in India and restructuring of European
business is a big positive: Restructuring of TATA Steel Europe (TSE)
and increased focus on Indian operations with a goal to double the capacity
(through organic and inorganic route) in next five years strengthens Tata
Steel further. In case of Europe, EBITDA/ton was ~Rs. 2600 Vs ~Rs. 2900
in Q2FY18 mainly due to maintenance shut down for business upgrades,
lower spread and higher coking coal prices and quarter ending December
is seasonally weak for Europe.
TATA is the highest bidder for Bhushan Steel: TATA officially
confirmed that the company’s bid for Bhushan Steel has been identified
as the highest evaluated Compliant Resolution Plan. With the strongest
presence by Tata Steel in domestic environment and Bhushan’s
exposure in downstream, value-added and Auto steels, the acquisition
further increase TATA’s market share in the Auto and value-added steels
market; and delivers the opportunity for further growth. Augmenting the
capacity of Kalinganagar by 5MnT at a capex of Rs. 23500 Mn and JV
with ThyssenKrupp for European operations on track and expected to
complete Q3FY19E.
Valuation and Risks: Based on Bloomberg Consensus and considering
risks of weak European business margins, delay in the ramping up of new
facilities, volatile raw material cost, we value the company at 10.7x FY20E
P/E for both India and international operations with a “BUY” rating and
arriving at a target price of Rs. 835 representing an upside potential of
47%.
Tata Steel Ltd
Valuation Summary
YE Mar (Rs. Mn) FY16 FY17 FY18E FY19E FY20E
Net Sales 1019647 1122994 1293457 1325783 1320372
EBITDA 79683 170078 209217 223663 227618
EBITDA Margin (%) 7.8 15.1 16.2 16.9 17.2
Adj. Net Profit (18333) 39476 65949 82216 87985
EPS (Rs.) (19.0) 41.0 62.3 72.8 78.0
RoE (%) (4.2) 10.3 16.1 16.0 14.9
PE (x)* (16.8) 11.8 9.1 7.8 7.3
Source: Bloomberg, Company, Karvy Research, *Represents multiples for FY16 & FY17 are based on historic market price
Relative Performance*
Source: Bloomberg; *Index 100
75
100
125
150
175
Mar-17
Apr-17
May-17
Jun-17
Jul-17
Aug -17
Sep-17
Oct-17
Nov-17
Dec-17
Jan-18
Feb-18
Mar-18
TATA
Sensex

KARVY WEALTH MAXIMIZER - MARCH 2018
22
Company Background
Established in Jamshedpur in 1907, Tata Steel, a company that took shape from the vision of Jamsetji N. Tata, is among
the top global steel company with an annual crude steel capacity of 27.5 million tons per annum (MTPA). It is the world’s
second-most geographically-diversified steel producer, with continuous improvement in product and service portfolio,
along with success in value creating initiatives for customers. Today, Tata Steel operates in 26 countries and have a
commercial presence in over 50 countries with employees across five continents. In India, its downstream business
activities are structured into strategic business units such as Ferro-alloys and Minerals, Tubes, Wires, Bearings, Agrico,
Industrial By-products Management & Tata Growth Shop.
TATASTEEL: Technical View
TATASTEEL: Stock has seen a correction of over 22%-24% from its all time high levels of Rs. 754.60 in past three
months. However, the stock is in stellar Bull Run and making higher highs & higher lows on the chart. The counter
has generated strong returns for the medium to long term investors where the stock has rallied from Rs. 200 levels
and made all time highs of Rs. 754.60 levels in the month of January 2018. On the other hand, after making all
time highs of Rs. 754.60 levels, the stock has witnessed a steep round of profit booking which dragged the stock
towards the lower support zone of Rs. 590-600 levels which may be utilized to enter the counter for long term period.
Technically, stock price is hovering near its 21 DEMA which is currently placed near Rs. 600-605 levels on weekly
chart, while stock is well poised above its long term moving average 100-DEMA (525). As far as the weekly RSI
(38.13) is concerned, it is also indicating a similar scenario as it is trading below the RSI Avg. (50.09) and the positive
momentum is likely to be revived once there is a positive crossover with the RSI cutting the RSI Avg. from below.
The supports for the stock is placed at Rs. 540-550 followed by Rs. 500 levels on the lower side while resistance is
pegged around Rs. 660-670 followed by Rs. 720-730 levels. Medium to long term investors may enter the stock at
current levels and utilize any dips as a buying opportunity. Hence, considering all the factual data mentioned above
the stock is looking pretty decent and is expected to surge towards its all time high once again, sustenance of which
it may move to the uncharted territory of Rs. 800-850 levels.

KARVY WEALTH MAXIMIZER - MARCH 2018
23
India Research - Stock Broking
Recommendation (Rs.)
CMP (as on Mar 23, 2018) 705
Target Price 1003
Upside (%) 42
Stock Information
Mkt Cap (Rs.Mn/US$ Mn) 358220 / 5509
52-wk High/Low (Rs.) 903 / 673
3M Avg.daily value (Rs. Mn)
1404.6
Beta (x) 1.0
Sensex/Nifty 32597 / 9998
O/S Shares(mn) 508.3
Face Value (Rs.) 2.0
Shareholding Pattern (%)
Promoters 27.8
FIIs 43.1
DIIs 12.2
Others 16.9
Stock Performance (%)
1M 3M 6M 12M
Absolute 1 (4) (13) (3)
Relative to Sensex 5 0 (14) (13)
Source: Bloomberg
Bloomberg Code: UPLL IN
Long Term Outlook Intact on back of high future
Global demand in Agrochemicals
High Diversification across Segments & Geographies Keep the
Growth Story Kicking: The global agrochemical segment generated a
value of US$ 4.4 bn in FY15 and is expected to grow at 7.5% p.a to reach
US $6.3bn by FY20 with India being the 4th largest global producer in the
world after US, Japan and China. UPL is now 2nd largest post-patent crop
protection chemical company and the 9th largest agrochemical company
in the world. It has done 25+ acquisitions since its inception to increase
distribution, brands and registrations. Crop protection market has entry
barriers because, high investments, R&D Cost and strict regulations.
The overall process of product registration remains difficult where UPL
has about 5934 registrations globally with over 1415 formulations, 200+
granted patents and a presence in over 130 countries, all of which add to
the topline of UPL.
Backward Integration to bring economies of scale: UPL is
consistently outperforming the global crop protection chemical industry
for the last 5 consecutive years. 60-65% of manufacturing takes place
in-house for UPL giving it a significant upper hand over players who are
dependent on China as a supplier of raw materials. Due to increasingly
stringent environmental norms in China, their supply to the global market
is reducing. UPL has outperformed the global crop protection chemical
industry by reporting revenue growth of 17% this year against the broad
sectors’ de-growth of 2.5%.
Valuation and Risks: The company posted decent set of numbers by
FY17. Sales increased by 16%; EBITDA grew at 24.6% while net profit
jumped 73% aided by other income. Going ahead we expect UPL will
continue to keep its profitability to high diversification across segments
and geographies. At CMP Rs. 705, As per consensus estimates, we
recommend ‘BUY’ for a price target of Rs. 1003 valuing UPL at 18x
FY20E EPS representing an upside potential of 42%.
UPL Ltd
Valuation Summary
YE Mar (Rs. Mn) FY16 FY17 FY18E FY19E FY20E
Net Sales 138340 160750 176983 199220 224072
EBITDA 23950 29850 34993 39905 45812
EBITDA Margin (%) 17.3 18.6 19.8 20.0 20.4
Adj. Net Profit 13070 17273 20403 23789 28327
EPS (Rs.) 30.5 34.1 40.1 47.1 56.2
RoE (%) 16.0 26.2 25.0 23.6 23.3
PE (x)* 25.8 21.3 17.9 15.2 12.8
Source: Bloomberg, Company, Karvy Research, *Represents multiples for FY16 & FY17 are based on historic market price
Relative Performance*
Source: Bloomberg; *Index 100
90
102
114
126
Mar-17
Apr-17
May-17
Jun-17
Jul-17
Aug -17
Sep-17
Oct-17
Nov-17
Dec-
17
Jan-18
Feb-18
Mar-18
UPLL
Sensex

KARVY WEALTH MAXIMIZER - MARCH 2018
24
UPL: Technical View
UPL: The stock has been in an uptrend since Rs. 354.88 levels made in February 2016 and rallied to its recent high
of Rs. 902.50 levels registered in the month of July 2017 a whopping gain of 153.60 percent in a span of around one
and half year. Thereafter, the stock went into correction mode and corrected lower towards 684 levels initially clocked
in the month of December 2017 and rallied again to make a lower low at Rs. 828.50 levels which was registered
in the month of January 2018; thereafter the stock again went into correction mode and traded lower towards
Rs. 672.50 levels cloaked in the month of February 2018. The correction from the highs of Rs. 900 levels to the low
of Rs. 672.50 levels is just around 33.84 percent from the top which is a normal correction in any bull market. The
price high at Rs. 902.50 made a full square of 30(30*30=900), which indicates that stock is respecting Gann Square
of Nine principle, which was again reaffirmed by the stock in recent price correction, where stock made a swing
low near Rs. 672.50 which happens to be another Gann square out number of 26 (26*26=676), and noticeably it
has also completed 720 degrees circle correction, which depicts power of Gann square of nine. On the price chart,
the stock is trading in the sideways range of Rs. 672.50-828.50 levels from past 11weeks, indicating sideways
corrective phase in a larger bull market. The stock is flirting with its 200-day Exponential moving average which is
currently placed around Rs. 754 levels; with the stock currently trading below it by around 12%. On the weekly chart,
the stock appears to be finding support near its weekly lower Bollinger band (20, 2, S) which is currently placed
around Rs. 680.50 levels. Also on the monthly charts the monthly mean of monthly Bollinger band (20, 2, S) is placed
around Rs. 745 levels. The 14 period RSI on the weekly chart is currently pegged at sub Rs. 41.86 levels, indicating
the stock is in bull market range. On the quarterly and monthly charts, prices are above its quarterly and monthly
parabolic SAR indicating long-term uptrend intact in the counter. Technical support for the stock is placed around
Rs. 660-665 levels followed by Rs. 580-600 levels while resistances are placed at Rs. 760-770 levels followed by
Rs. 820-830 levels.
Company Background
With over 1415 formulations, 200+ granted patents, US$ 2.56 Bn revenue in FY17 and a presence in over 130 countries
United Phosphorus, under the leadership of Mr. Rajnikant Devidas Shroff (Chairman, MD, Promoter-Director) started
with the manufacture of Red Phosphorus in 1969 and entered into the agrochemical exports business for the first time
in 1976. UPL Ltd. manufactures phosphorus & phosphorus-based compounds and its products include herbicides,
fungicides, insecticides, fumigants and rodenticides. United Phosphorus also manufactures industrial chemicals, specialty
chemicals and chloralkaline products. The company is engaged in the business of agrochemicals, industrial chemicals,
chemical intermediates and specialty chemicals. The Agro activity segment includes the manufacture and marketing
of conventional agrochemical products, seeds and other agricultural related products. The Non-agro activity segment
includes manufacture and marketing of industrial chemical and other non-agricultural related products. It offers fungicides,
herbicides, insecticides, plant growth and regulators, rodenticides, industrial and specialty chemicals, and nutrifeeds.

KARVY WEALTH MAXIMIZER - MARCH 2018
25
Wealth Maximizer - Largecap (WM) is an investment product of Karvy Stock Broking Ltd formulated
by our Equity Fundamental & Technical Research, based on Techno-Funda Analysis. It enlists 10 stocks from
the Karvy Large-cap stock universe.
The objective of ‘Wealth Maximizer’ is to deliver superior returns over an extended time frame. The investment
philosophy works on simple but superior fundamental research.
The 10 large cap companies in this product in our opinion reflects superior businesses with consistent future
cash flows, run competently and have potential for growth.
We also track short-term price distortions that create long-term value, driven by sound economic fundamentals
of the company. This reflects stocks that have margin of safety will converge to their intrinsic value over a
period of time and will reflect superior returns.
This is also a part of managing the overall risk, the objective is to attain higher risk adjusted returns and deliver
consistent out-performance.
The stocks performance will be assessed on an ongoing basis and the composition of the stocks in the
product will be altered based on target achievement, changes in the fundamentals of the stocks, industry
position, market performance and broad macro-economic factors.
The product is being given to the clients in the form of non-binding investment recommendations so that
they can decide to capitalise on the robust fundamentals and future plans of the company, which are being
discussed in the report.

KARVY WEALTH MAXIMIZER - MARCH 2018
26
Disclaimer
Analyst certification: The following analyst(s), Vivek Ranjan Misra who is (are) primarily responsible for this report and whose name(s)
is/are mentioned therein, certify (ies) that the views expressed herein accurately reflect his (their) personal view(s) about the subject security
(ies) and issuer(s) and that no part of his (their) compensation was, is or will be directly or indirectly related to the specific recommendation(s)
or views contained in this research report.
Disclaimer: Karvy Stock Broking Limited [KSBL] is registered as a research analyst with SEBI (Registration No INH200003265). KSBL is
also a SEBI registered Stock Broker, Depository Participant, Portfolio Manager and also distributes financial products. The subsidiaries and
group companies including associates of KSBL provide services as Registrars and Share Transfer Agents, Commodity Broker, Currency
and forex broker, merchant banker and underwriter, Investment Advisory services, insurance repository services, financial consultancy and
advisory services, realty services, data management, data analytics, market research, solar power, film distribution and production, profiling
and related services. Therefore associates of KSBL are likely to have business relations with most of the companies whose securities are
traded on the exchange platform. The information and views presented in this report are prepared by Karvy Stock Broking Limited and
are subject to change without any notice. This report is based on information obtained from public sources , the respective corporate
under coverage and sources believed to be reliable, but no independent verification has been made nor is its accuracy or completeness
guaranteed. The report and information contained herein is strictly confidential and meant solely for the selected recipient and may not be
altered in any way, transmitted to, copied or distributed, in part or in whole, to any other person or to the media or reproduced in any form,
without prior written consent of KSBL. While we would endeavor to update the information herein on a reasonable basis, KSBL is under no
obligation to update or keep the information current. Also, there may be regulatory, compliance or other reasons that may prevent KSBL
from doing so. The value and return on investment may vary because of changes in interest rates, foreign exchange rates or any other
reason. This report and information herein is solely for informational purpose and shall not be used or considered as an offer document
or solicitation of offer to buy or sell or subscribe for securities or other financial instruments. Though disseminated to all the customers
simultaneously, not all customers may receive this report at the same time. KSBL will not treat recipients as customers by virtue of their
receiving this report. Nothing in this report constitutes investment, legal, accounting and tax advice or a representation that any investment
or strategy is suitable or appropriate to your specific circumstances. This material is for personal information and we are not responsible for
any loss incurred based upon it. The investments discussed or recommended in this report may not be suitable for all investors. Investors
must make their own investment decisions based on their specific investment objectives and financial position and using such independent
advice, as they believe necessary. While acting upon any information or analysis mentioned in this report, investors may please note that
neither KSBL nor any associate companies of KSBL accepts any liability arising from the use of information and views mentioned in this
report. Investors are advised to see Risk Disclosure Document to understand the risks associated before investing in the securities markets.
Past performance is not necessarily a guide to future performance. Forward-looking statements are not predictions and may be subject to
change without notice. Actual results may differ materially from those set forth in projections.
Associates of KSBL might have managed or co-managed public offering of securities for the subject company or might have been mandated
by the subject company for any other assignment in the past twelve months.
Associates of KSBL might have received compensation from the subject company mentioned in the report during the period preceding
twelve months from the date of this report for investment banking or merchant banking or brokerage services from the subject company
in the past twelve months or for services rendered as Registrar and Share Transfer Agent, Commodity Broker, Currency and forex broker,
merchant banker and underwriter, Investment Advisory services, insurance repository services, consultancy and advisory services, realty
services, data processing, profiling and related services or in any other capacity.
KSBL encourages independence in research report preparation and strives to minimize conflict in preparation of research report.
Compensation of KSBL’s Research Analyst(s) is not based on any specific merchant banking, investment banking or brokerage service
transactions.
KSBL generally prohibits its analysts, persons reporting to analysts and their relatives from maintaining a financial interest in the securities or
derivatives of any companies that the analysts cover.
KSBL or its associates collectively or Research Analysts do not own 1% or more of the equity securities of the Company mentioned in the
report as of the last day of the month preceding the publication of the research report.
KSBL or its analysts did not receive any compensation or other benefits from the companies mentioned in the report or third party in
connection with preparation of the research report and have no financial interest in the subject company mentioned in this report.
Accordingly, neither KSBL nor Research Analysts have any material conflict of interest at the time of publication of this report.
It is confirmed that KSBL and Research Analysts, primarily responsible for this report and whose name(s) is/ are mentioned therein of this
report have not received any compensation from the subject company mentioned in the report in the preceding twelve months.
It is confirmed that Vivek Ranjan Misra, Research Analyst did not serve as an officer, director or employee of the companies mentioned
in the report.
KSBL may have issued other reports that are inconsistent with and reach different conclusion from the information presented in this report.
Neither the Research Analysts nor KSBL have been engaged in market making activity for the companies mentioned in the report.
We submit that no material disciplinary action has been taken on KSBL by any Regulatory Authority impacting Equity Research Analyst
activities.

KARVY WEALTH MAXIMIZER - MARCH 2018
27
Investor Grievance Cell Email: igksblsb@karvy. com,
SEBI Reg. No’s NSE: INB/INF/INE 230770138,
BSE: INB/INF 010770130/010770131,
MSEI: INE 260770138, DP: IN-DP-175-2015,
PMS Regd No. INP000001512
www.karvyonline.com
1800 419 8283
research@karvy.com
Reg. Oce
Karvy Centre, 8-2-609/k Avenue 4,
Street No.1, Banjara Hills,
Hyderabad-500 034.
Tel : +91-40-23312454
Fax : +91-40-23311968
Corporate Oce
Karvy Millennium, Plot No.31,
Financial District, Gachibowli,
Hyderabad-500 032.
f
in
You
Tube